After Urda: an open map of Spain's trains

Nov 1, 2026 · 6 min read
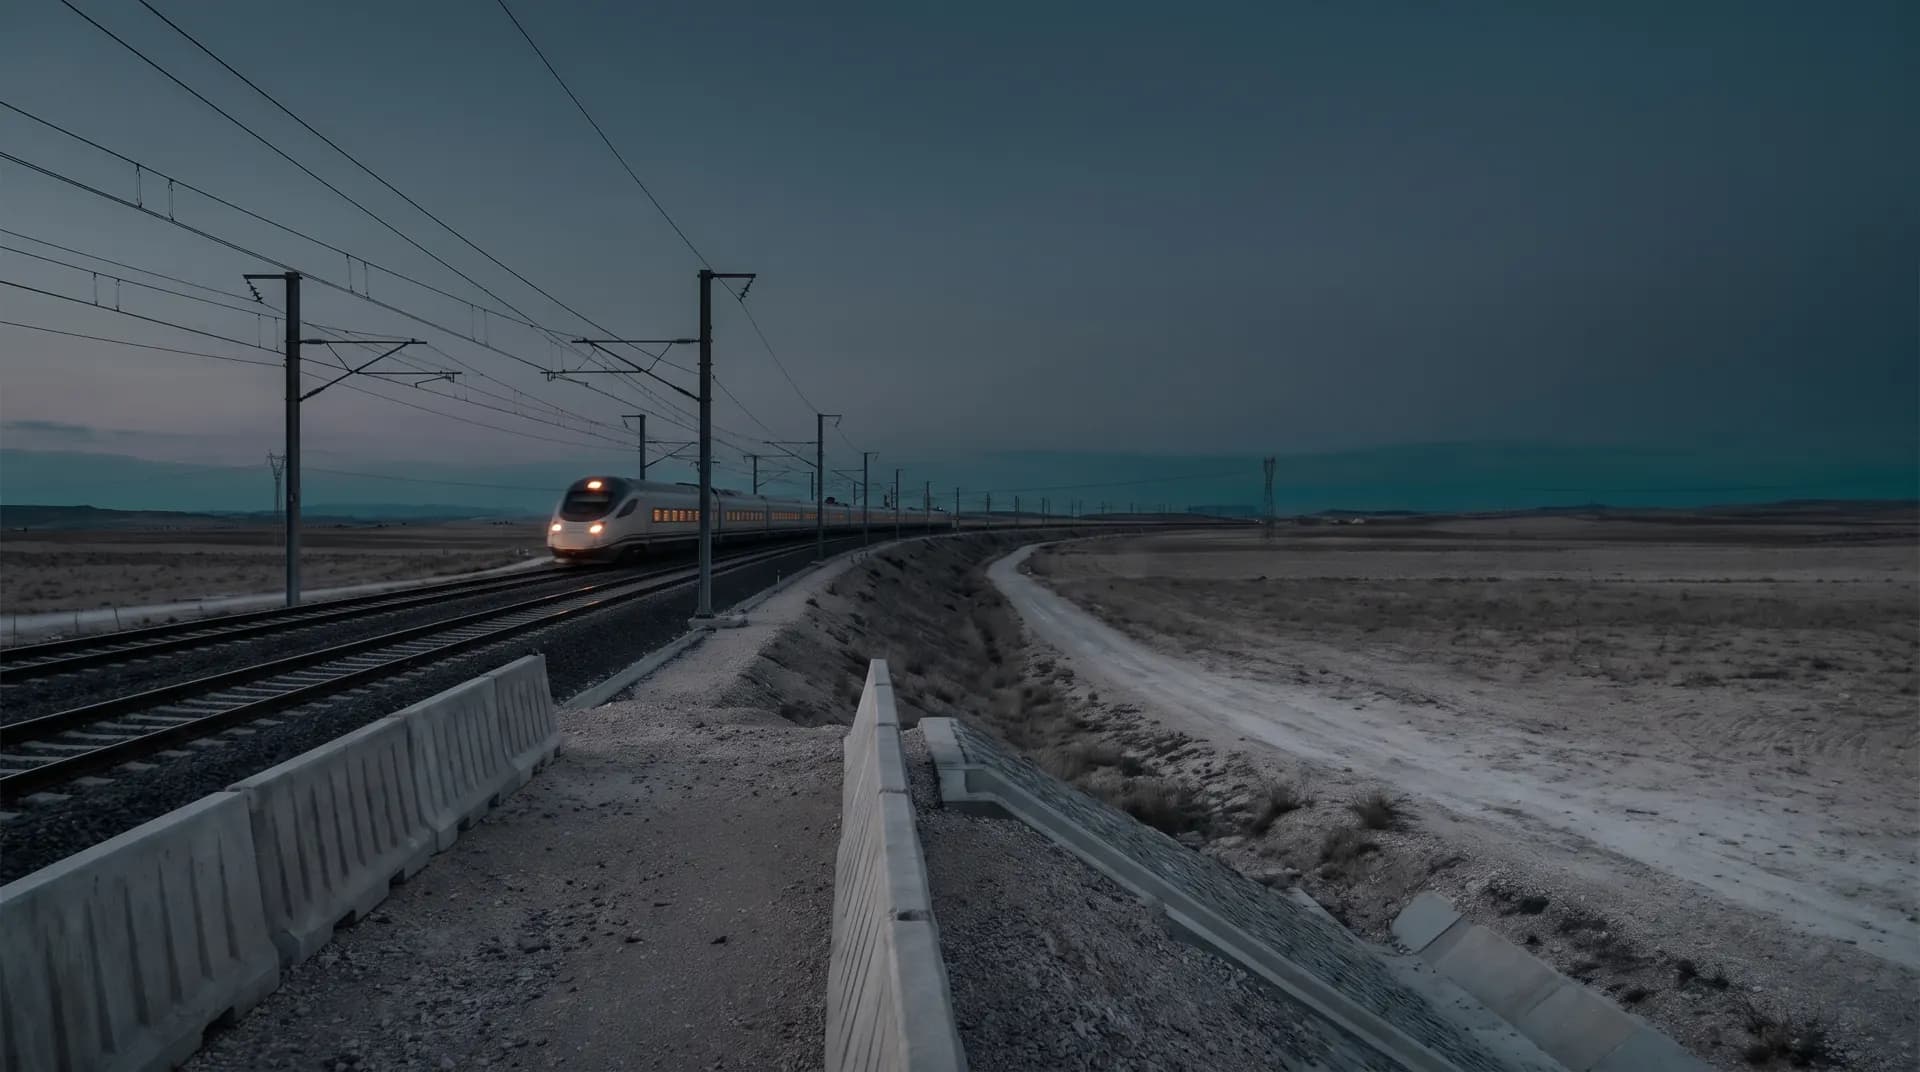
On Tuesday 28 October, shortly before nine in the morning, a Renfe AVE and an Iryo train collided between Los Yébenes and Urda, in Toledo, on the Madrid–Andalusia line. According to the regional government of Castilla-La Mancha, at least 69 people have died and more than a hundred have been injured. These figures are provisional.
First of all, our thoughts are with the victims, their families and everyone who worked for hours on the track. The investigation belongs to AITAT, the independent authority that investigates railway accidents in Spain, and to the Guardia Civil. We will not speculate about the causes, and nothing in this article tries to explain them.
What we noticed
Following the news, something smaller but concrete caught our attention: how hard it is, in general, to know where a train is. The information exists, spread across each operator's app, station boards and social media, but not in one simple, open place that works on any phone.
Renfe, FGC, Metro Bilbao and Euskotren publish the positions of their trains as open data. It is a valuable public service that almost nobody sees, because it is built for machines, not people. We thought we could do something useful with it.
What we built
trenes.valfiguer.com is a real-time map of the trains running in Spain. It is free, has no ads, needs no account and carries no brand: we did not want our name to be the first thing people saw on something that came after a tragedy.
- Where each train is, with its line, its delay and its next stop, drawn on the actual track.
- Station boards with departures for the next two hours, like the ones on the platforms.
- Alerts and disruptions from the operators, in one place.
- Installs on your phone like an app, without going through any store.
And what it is not: it is not a safety system or an official source. It shows what the operators publish, with whatever delays and gaps that data has, and it says so when a figure is old or missing.
Accessibility was not an extra
If the point is that anyone can check where a train is, the site has to work for anyone. Some concrete decisions:
- The Atkinson Hyperlegible typeface, designed to stay readable with low vision.
- No status relies on colour alone: on time, delayed or no data always come with an icon and a word.
- Animations are reduced when the system asks for less motion.
- Controls are labelled for screen readers and work with a keyboard.
- Visit measurement is optional and stays off until you accept it.
Built in a day
Work started in the early hours of 1 November and the site was live by early afternoon: about twelve hours, 67 commits and roughly 26,000 lines of code.
That was possible because we worked with several AI agents (Claude Code) in parallel: while one prepared the images that appear when a link is shared, another built sign-in and another the train motion. We decided what to build, reviewed every change in a real browser and shipped it.
It was not magic. The most useful part was what went wrong:
- The data is sometimes wrong. Some commuter trains showed up at 339 km/h. We set a realistic speed cap per type of service and discard what does not add up.
- A dot is not a train. At first trains slid sideways and drifted off the track. Now they are drawn to scale, in their service's colours with a cab at each end, facing their direction of travel and snapped to the OpenStreetMap railway geometry.
- Speed does not replace judgement. Agents write code fast; deciding what not to do, what not to promise and how to talk about an accident is still people's work.
Why we are sharing this
A few years ago a project like this would have taken a team weeks. Today a small team can ship it in a day, on data that is already public. That is the part of technology we care about: getting useful things to more people, sooner, at no cost to those who use them.
The site will stay free and open. If you spot an error or miss something, let us know.
And, once more, our thoughts are with the victims of Urda and their families.